Affiliate disclosure: This article contains affiliate links. If you sign up or upgrade through our TradingView link, MyTradingApps may earn a commission at no extra cost to you. We only recommend tools that fit a serious trading workflow.
Educational disclaimer: This guide is for educational purposes only. It is not financial advice, investment advice, trading advice, or a recommendation to buy, sell, or trade any asset. Trading involves risk. Always do your own research and use proper risk management.
If you are serious about trading, your charting platform becomes more than a screen full of candles.
It becomes your trading map.
It shows you where price has been, where volatility is building, where structure is shifting, and where your own emotions are starting to scribble on the glass.
That is why TradingView has become one of the most recognized charting platforms in the world. It is used by forex traders, crypto traders, stock investors, futures traders, technical analysts, market educators, and beginners trying to make sense of their first candlestick chart.
But popularity alone does not answer the real question:
Is TradingView worth it in 2026?
The answer is yes for most traders, but with one important warning:
TradingView is a powerful tool, not a complete trading system by itself.
A charting platform can help you see the market clearly. It can give you alerts, screeners, economic events, news, community ideas, custom indicators, and paper trading. But it cannot create discipline for you. It cannot journal your trades for you. It cannot stop you from chasing price after one emotional candle.
That is where a complete workflow matters.
In this long-form TradingView review, we will break down exactly what TradingView does, who it is best for, which features matter most, how the pricing works, how it compares with other platforms, and how to connect it with a structured trading process through MyTradingApps.com.
By the end, you will know whether TradingView belongs in your toolkit and how to use it without falling into the classic beginner trap of collecting tools instead of building consistency.
Ready to try TradingView now?
Quick Verdict: Is TradingView Worth It?
For most active traders, TradingView is worth it because it combines high-quality charts, alerts, screeners, economic calendar data, news, community ideas, broker connections, paper trading, and custom indicator tools in one platform.
If you are brand new, the free plan can be enough to learn the interface and start marking charts. If you trade regularly, the paid plans become more useful because they unlock more alerts, more indicators per chart, more chart layouts, less friction, and a cleaner workspace.
Here is the simplest way to think about it:
- **Beginner trader:** Use TradingView to learn charts, timeframes, watchlists, and simple technical analysis.
- **Active trader:** Use TradingView for charting, alerts, screeners, economic context, and daily market preparation.
- **Advanced trader:** Use TradingView for custom indicators, Pine Script, multi-chart layouts, technical alerts, paper trading, and broker-connected workflows.
- **Process-focused trader:** Use TradingView for analysis, then use MyTradingApps.com to connect chart review, journaling, timing, and discipline into one repeatable workflow.
TradingView is not the magic button.
It is the lens.
Your trading process is the engine.
What Is TradingView?
TradingView is a cloud-based charting and market analysis platform. Instead of installing a heavy desktop terminal, you can open TradingView in a browser or use its desktop and mobile apps. Your layouts, drawings, watchlists, and settings can sync across devices, which makes it useful for traders who move between a laptop, desktop setup, and phone.
At its core, TradingView gives you:
- Interactive price charts
- Multiple chart types
- Technical indicators
- Drawing tools
- Watchlists
- Alerts
- Screeners
- Economic calendars
- News tools
- Community trading ideas
- Paper trading
- Broker connections
- Pine Script for custom indicators and strategies
That sounds like a lot because it is a lot. TradingView is not only “a chart.” It is closer to a market workspace.
The reason it became so popular is simple: it made professional-looking charting feel easy. Many older trading platforms are powerful but clunky. They feel like dusty control panels from a submarine. TradingView feels cleaner, faster, and more natural for modern traders.
That matters because trading already has enough friction. Your platform should not fight you while you are trying to read the market.
Why TradingView Is So Popular
TradingView became popular because it solved three problems traders constantly deal with.
First, it made charts easier to use. Traders can mark levels, switch timeframes, apply indicators, compare symbols, and save layouts without needing a complicated installation process.
Second, it made analysis portable. Because TradingView is cloud-based, your work can follow you across devices. You can mark a level on your laptop and later check the same chart on your phone.
Third, it added community. TradingView is not just a private charting terminal. It includes public ideas, scripts, discussions, and educational content from other users. That social layer makes it useful for learning, but also dangerous if you copy other people's trade ideas blindly.
A good way to use TradingView is to treat the community as a classroom, not a signal service.
Read how others think. Study how they mark structure. Compare their logic to your own. But never outsource your responsibility.
TradingView Supercharts: The Main Reason Traders Use It
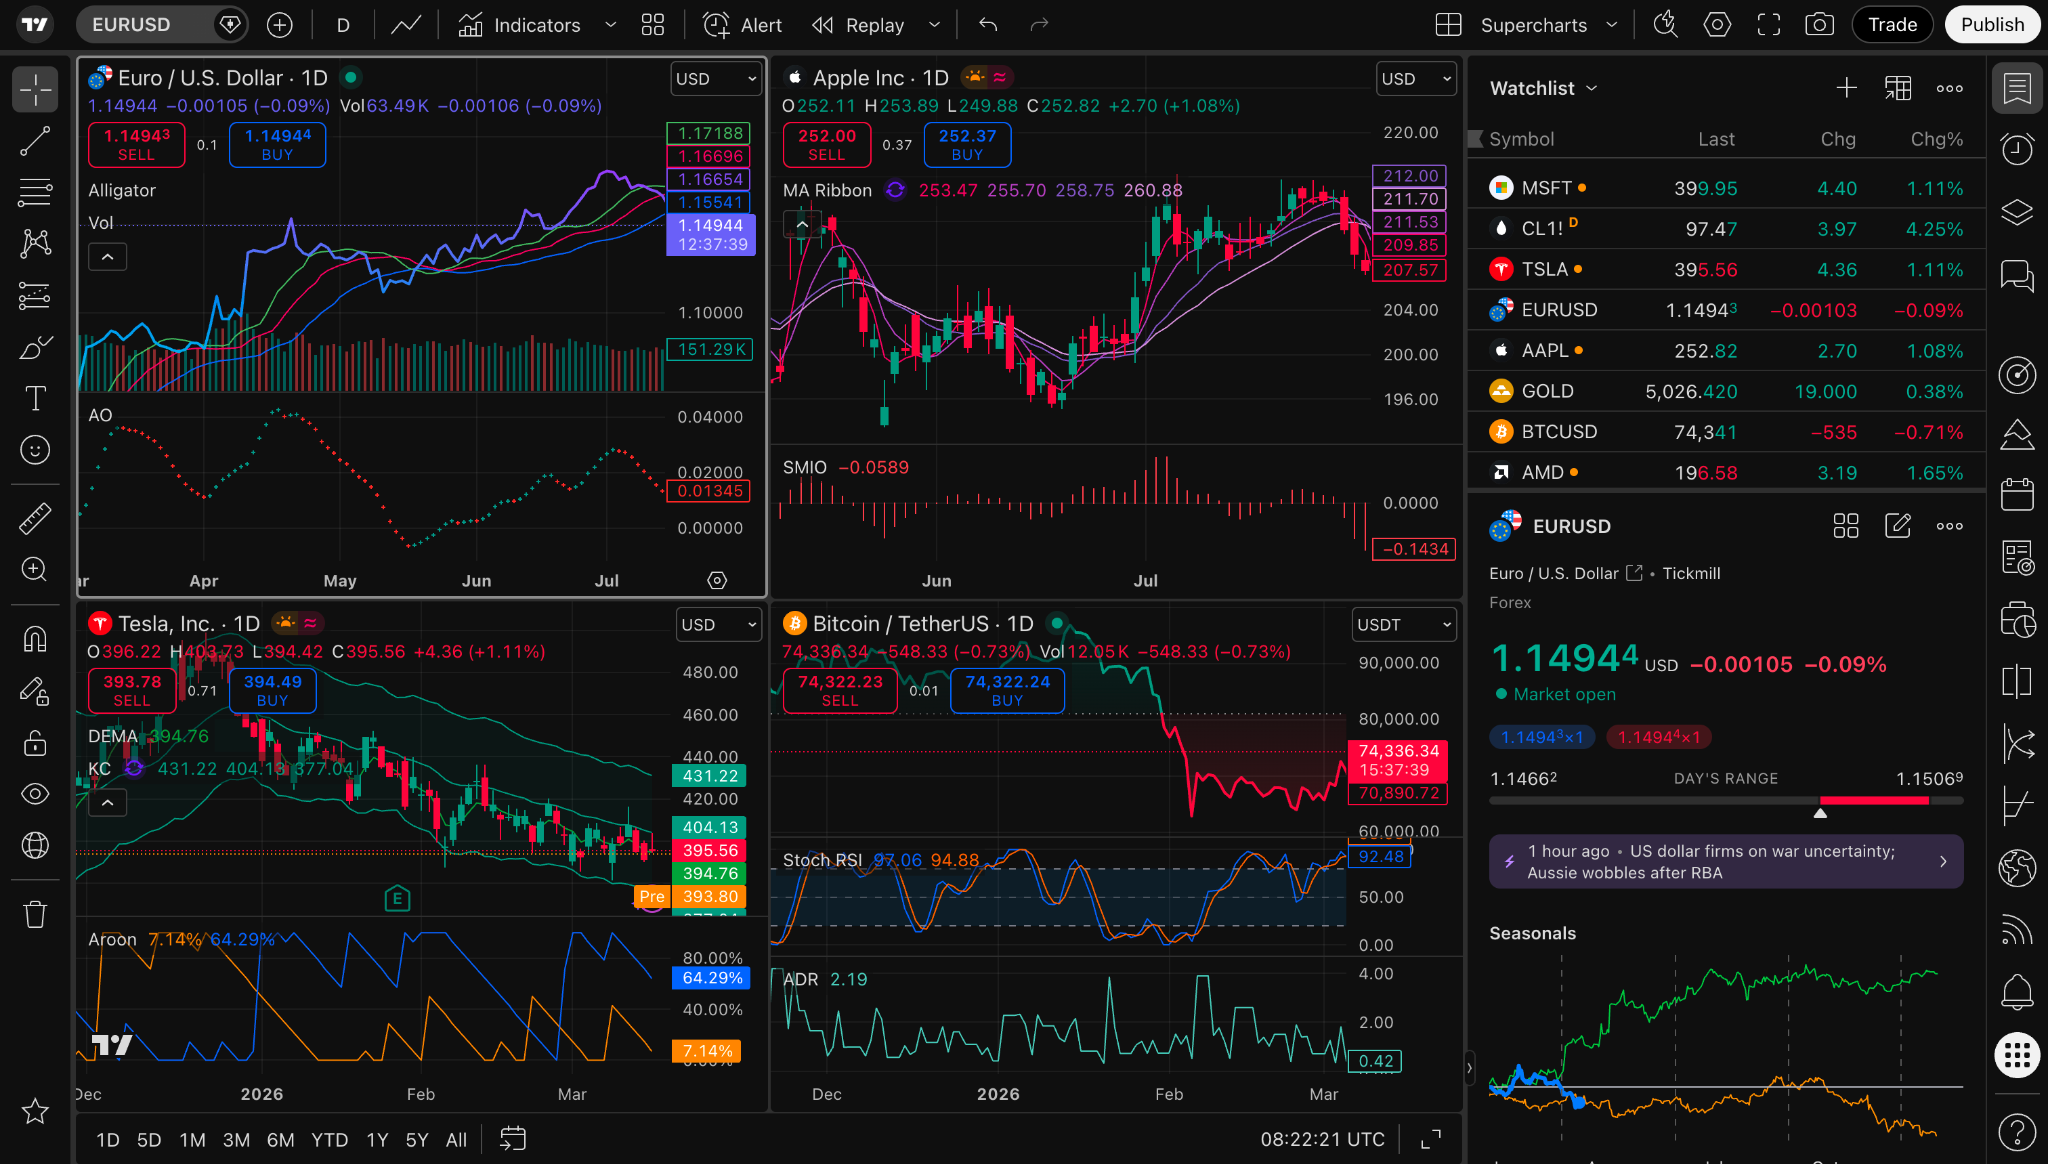
The heart of TradingView is its charting system, often referred to as Supercharts.
This is where most traders spend their time. You can view price action, apply indicators, compare assets, mark levels, add notes, use drawing tools, and move between timeframes.
For technical traders, this is the main attraction.
TradingView charts are useful for:
- Support and resistance analysis
- Trendline analysis
- Market structure
- Liquidity zones
- Range behavior
- Breakout and retest study
- Session-based analysis
- Indicator-based analysis
- Multi-timeframe review
- Educational chart annotation
If you trade forex, you can study major pairs, crosses, indices, commodities, and session behavior. If you trade crypto, you can follow 24/7 markets and compare exchanges. If you trade stocks, you can review long-term structures, earnings reactions, sector strength, and watchlist setups.
The clean interface matters because traders often overcomplicate everything. A noisy chart can become a psychological swamp. You add one indicator, then another, then another, until the actual price chart looks like it is hiding behind neon spaghetti.
TradingView gives you the power to add complexity, but the best traders usually keep their chart simple.
The real edge is not having 19 indicators.
The edge is knowing what you are looking for before you open the chart.
Multi-Timeframe Analysis: Why One Chart Is Not Enough
One of TradingView’s biggest advantages is how easily it supports multi-timeframe analysis.
A beginner often looks at one chart and makes a decision from that single view. That is usually where confusion starts.
Price can look bullish on the 5-minute chart while still being bearish on the 4-hour chart. A breakout can look strong on a lower timeframe but be running directly into higher-timeframe resistance. A pullback can feel scary on a small chart while still being normal inside a larger trend.
TradingView makes it easier to move through context:
- Daily chart for major trend and macro structure
- 4-hour chart for swing structure
- 1-hour chart for intraday context
- 15-minute or 5-minute chart for lower-timeframe detail
- 1-minute chart for very short-term execution study
That does not mean every trader needs every timeframe. It means your analysis should not be trapped inside one candle cave.
If you are studying ICT concepts, Wyckoff phases, or session behavior, multi-timeframe analysis becomes even more important. A liquidity sweep on a lower timeframe may only make sense when you understand where it happened in the higher-timeframe range.
For deeper educational context, you can connect this section internally to your existing articles:
- ICT Smart Money Concepts — Liquidity Pools and Smart Money
- Wyckoff Market Cycle — Understanding Accumulation, Markup, Distribution, and Markdown
These internal links help readers move from platform review into your own educational content, instead of bouncing away after reading about TradingView.
TradingView Indicators: Useful, but Easy to Overuse
TradingView includes a large library of technical indicators. You can use common tools like:
- Moving averages
- RSI
- MACD
- VWAP
- Bollinger Bands
- Volume tools
- Session indicators
- Volatility tools
- Custom community scripts
Indicators can be useful because they help traders visualize momentum, trend, volatility, and mean reversion. But indicators can also become a hiding place for uncertainty.
A trader who does not have a process may keep adding tools until something “confirms” the trade they already want to take. That is not analysis. That is decoration with candles.
The better approach is to choose indicators based on a clear purpose.
For example:
- Use moving averages to understand trend direction or dynamic areas of interest.
- Use VWAP to study average session price and institutional positioning.
- Use RSI to study momentum or divergence.
- Use volume tools to study participation and effort.
- Use session indicators to understand time-based volatility.
The question is never, “Which indicator is best?”
The better question is:
What decision does this indicator help me make?
If the answer is unclear, remove it.
Clean charts usually produce cleaner thinking.
TradingView Alerts: Stop Staring at Charts All Day
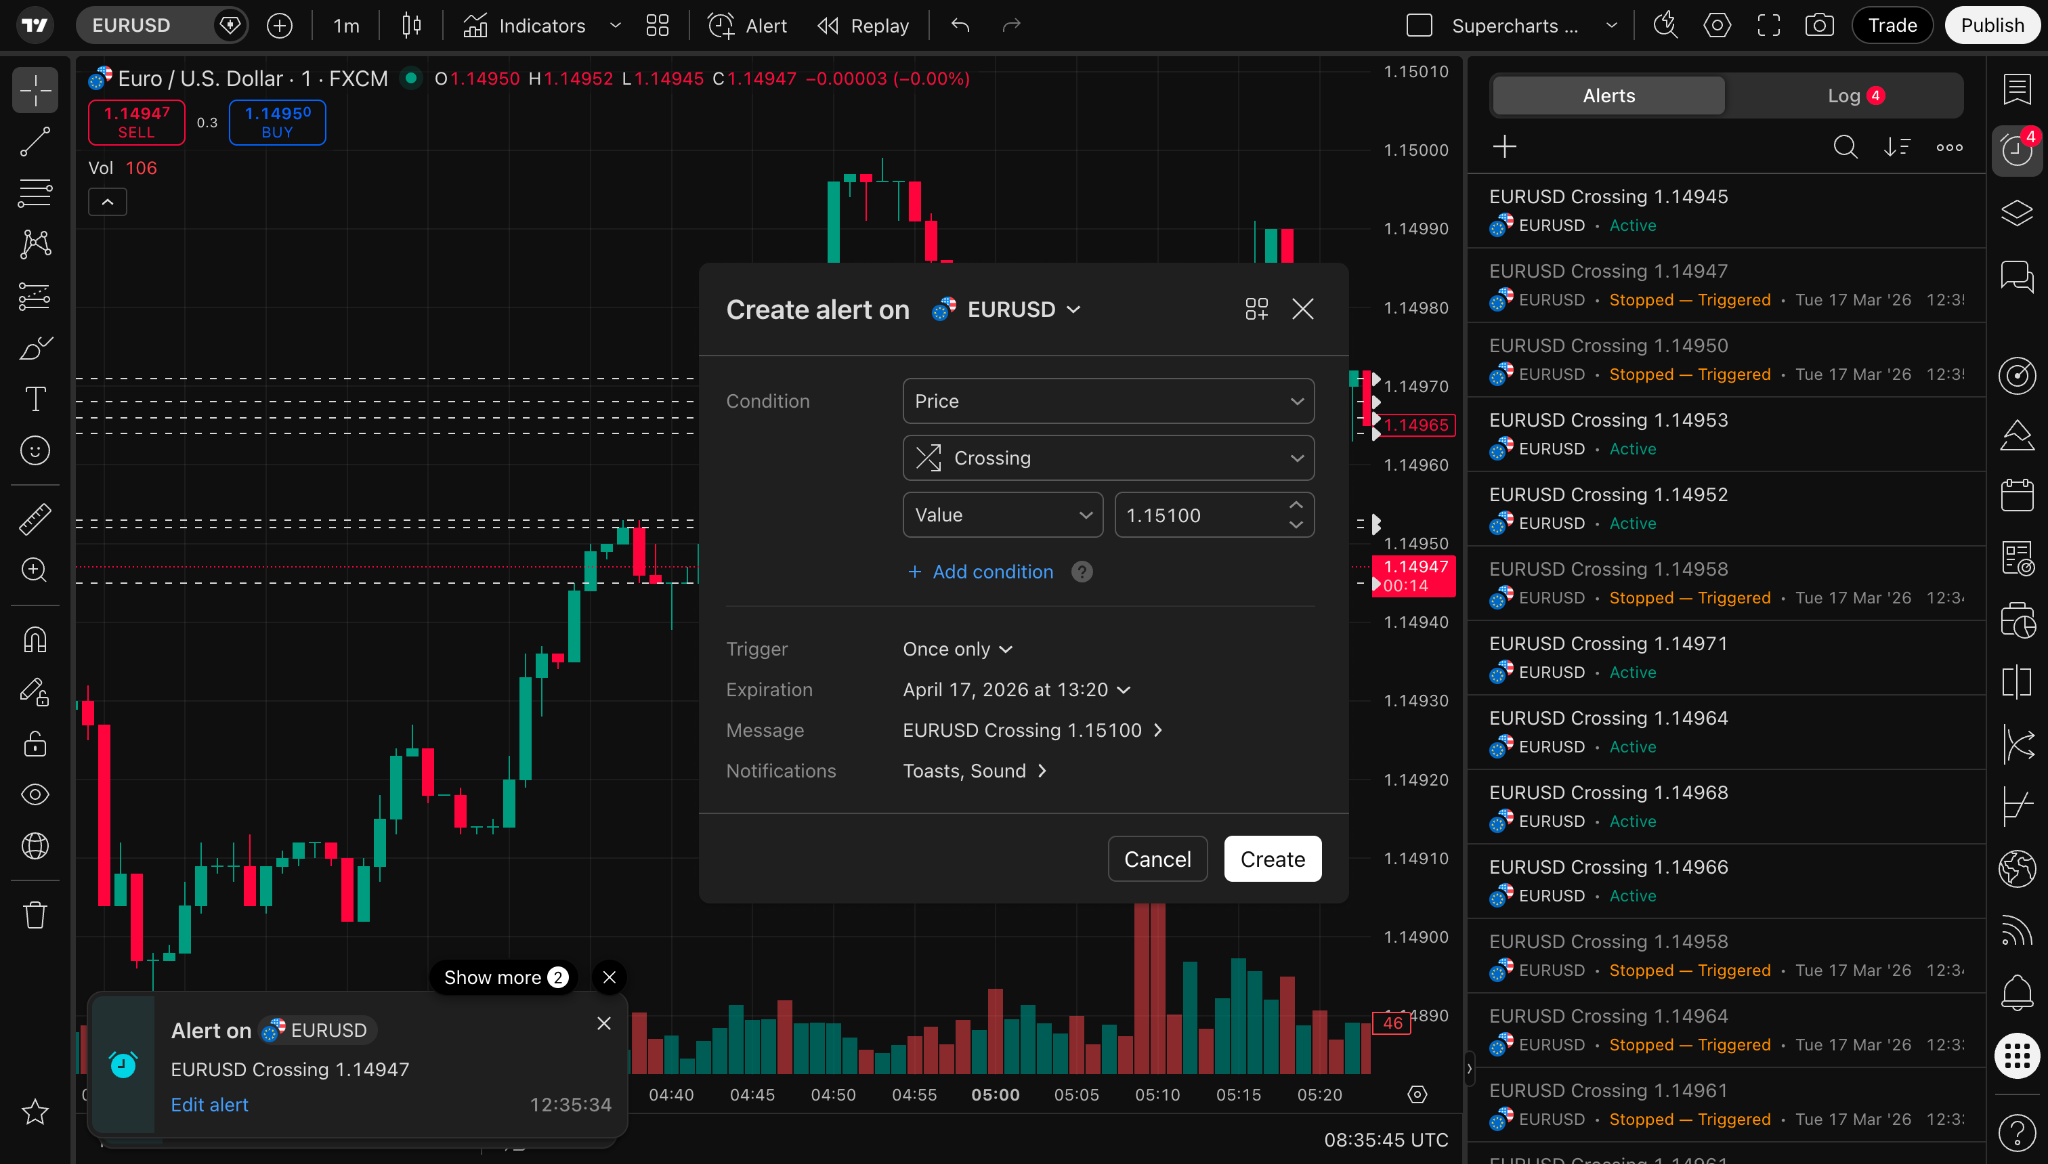
Alerts are one of TradingView’s most important features.
Many traders waste hours staring at charts, waiting for price to reach a level. That creates fatigue. Fatigue creates bad decisions. Bad decisions create journal entries that look like apology letters to your account balance.
TradingView alerts help solve this.
You can set alerts for:
- Price crossing a level
- Price entering a zone
- Indicator conditions
- Trendline breaks
- Drawing tool interactions
- Strategy conditions
- Multi-condition setups on higher plans
This changes your workflow.
Instead of chasing every candle, you define important areas in advance and let TradingView notify you when price reaches them.
That is powerful because good trading usually requires waiting.
Waiting is boring.
Alerts make waiting easier.
A strong alert workflow might look like this:
- Review higher-timeframe structure.
- Mark key levels.
- Define what would make the level interesting.
- Set TradingView alerts.
- Step away from the chart.
- Return only when the market reaches your area.
- Review the setup with your written rules before acting.
This is not only a technical improvement. It is a discipline improvement.
You are turning emotional reaction into structured preparation.
For readers who struggle with patience, internally link to:
How to Build Discipline — The Missing 90%
That link fits naturally because alerts are not only about convenience. They are about reducing impulsive screen behavior.
TradingView Stock Screener: Find Opportunities Faster
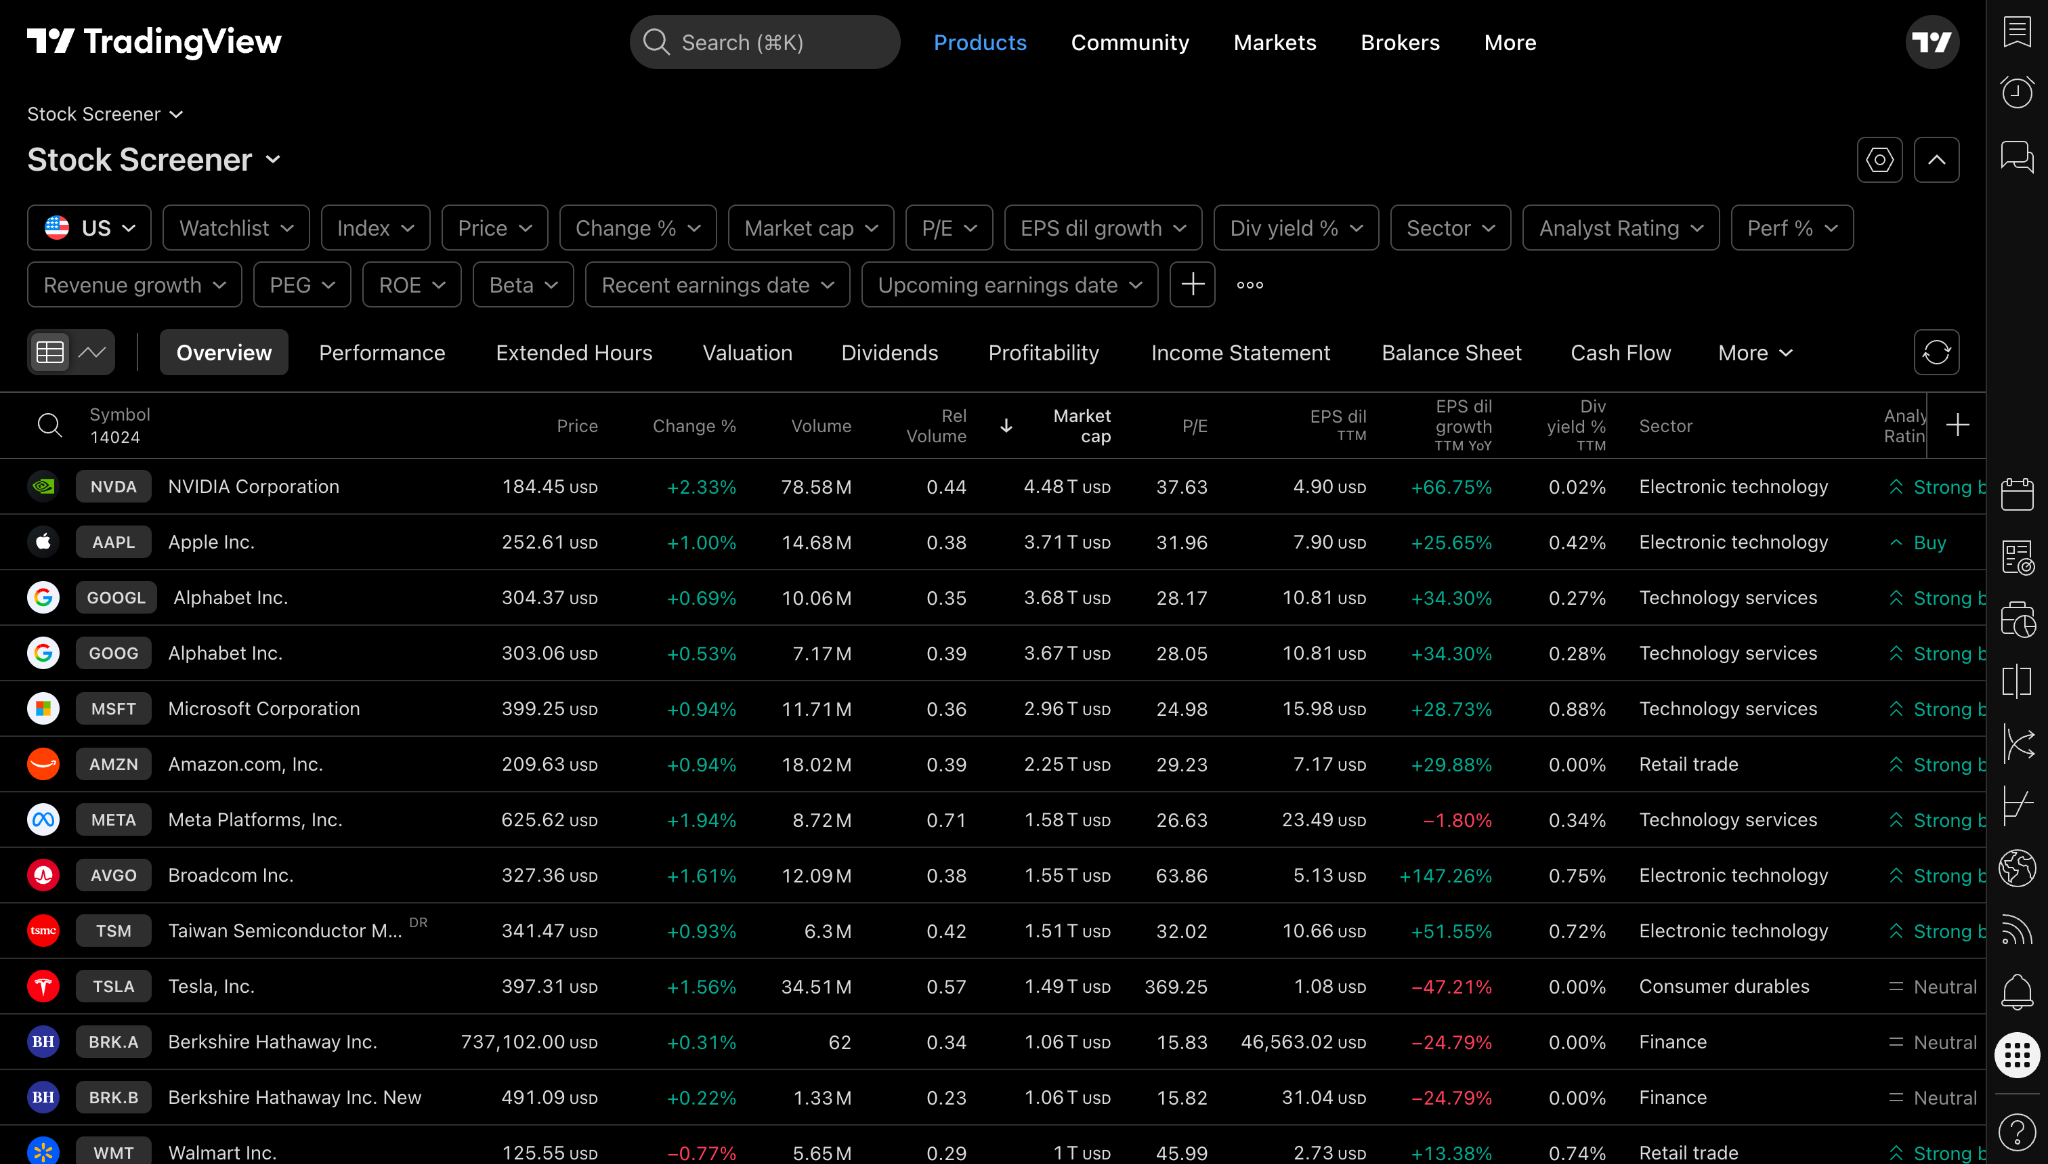
TradingView is not only for looking at one chart at a time. It also includes screeners that help traders filter markets based on different criteria.
A screener helps you answer questions like:
- Which stocks are moving strongly today?
- Which assets have unusual volume?
- Which cryptocurrencies are leading the market?
- Which ETFs are showing strength?
- Which symbols match specific technical filters?
- Which markets are near new highs or lows?
The official TradingView feature pages describe multiple screeners across stocks, ETFs, bonds, crypto coins, centralized exchange pairs, and decentralized exchange pairs. This makes TradingView useful for idea generation, not only analysis.
For stock traders, a screener can shorten the research process. Instead of clicking through random tickers, you create filters and let the platform bring candidates to you.
For crypto traders, screeners can help identify strength, weakness, volume shifts, and market rotation.
For beginners, the screener can be overwhelming at first. Start simple. Use only a few filters. Look for liquidity, volume, and structure before chasing tiny names with giant percentage moves.
A screener should help you narrow the market.
It should not hypnotize you into taking trades because a row turned green.
TradingView Economic Calendar: Trade With Context
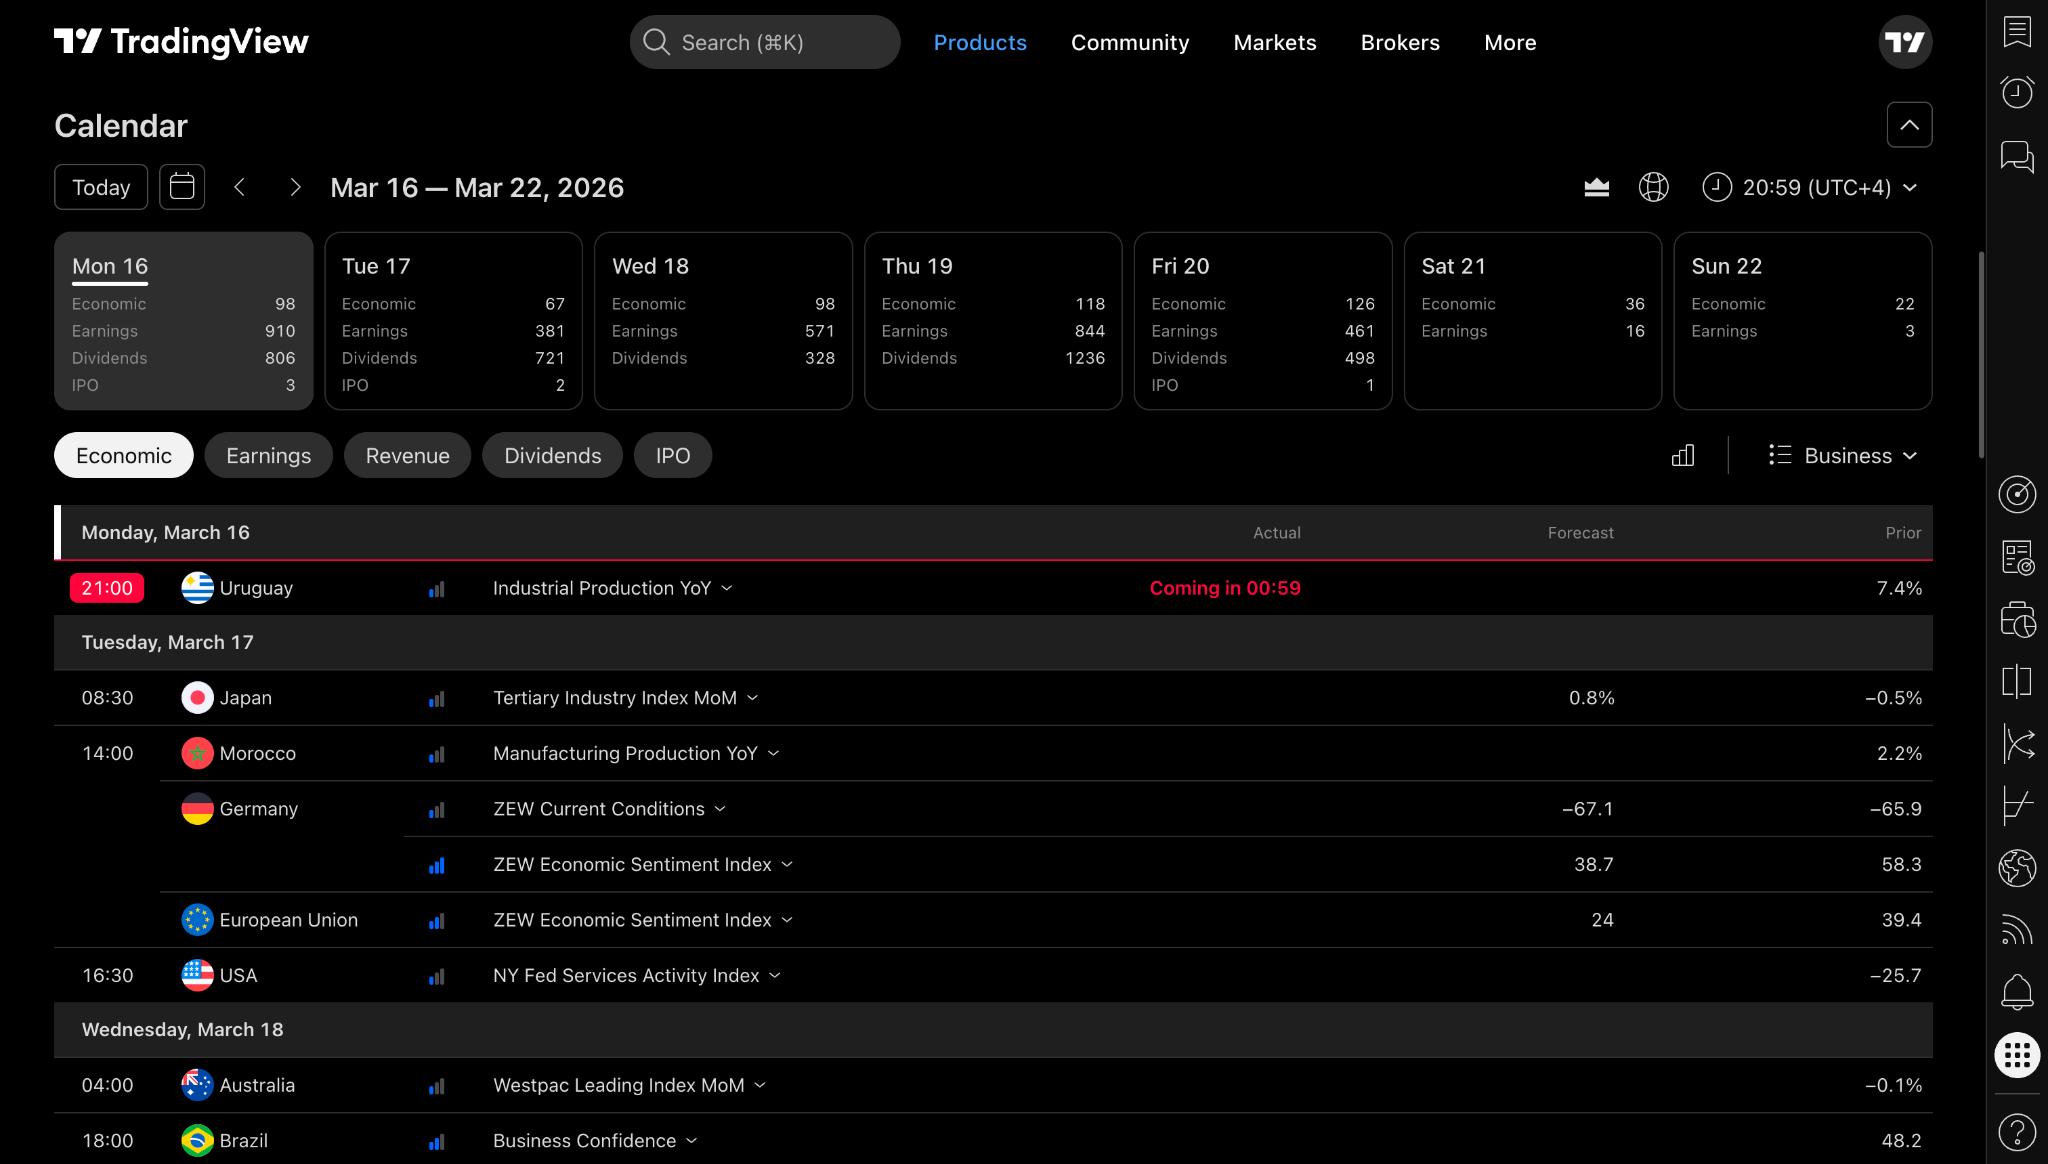
The economic calendar is especially important for forex, indices, commodities, and macro-sensitive markets.
Markets do not move in a vacuum. Price often reacts to data releases, central bank decisions, employment reports, inflation numbers, and unexpected headlines.
TradingView’s economic calendar can help you track events such as:
- Interest rate decisions
- Inflation data
- Employment data
- GDP reports
- Central bank speeches
- Manufacturing data
- Consumer confidence reports
- Earnings events and corporate reports
This is not about predicting the news.
It is about knowing when volatility may appear.
A trader who ignores the calendar can get surprised by sudden movement and call it “random.” Often, the market was not random. The trader was simply unaware of the event.
A simple calendar workflow:
- Before the trading day, check major scheduled events.
- Mark the time of high-impact releases.
- Avoid entering emotionally right before major data.
- Watch how price behaves after the event.
- Journal whether your plan respected the calendar.
This is why TradingView is useful beyond the chart. It helps traders connect technical structure with market context.
For MyTradingApps internal linking, this section should point toward session and timing education:
This creates a strong bridge between TradingView’s market calendar and your site’s timing-focused education.
TradingView News Flow: Real-Time Market Intelligence
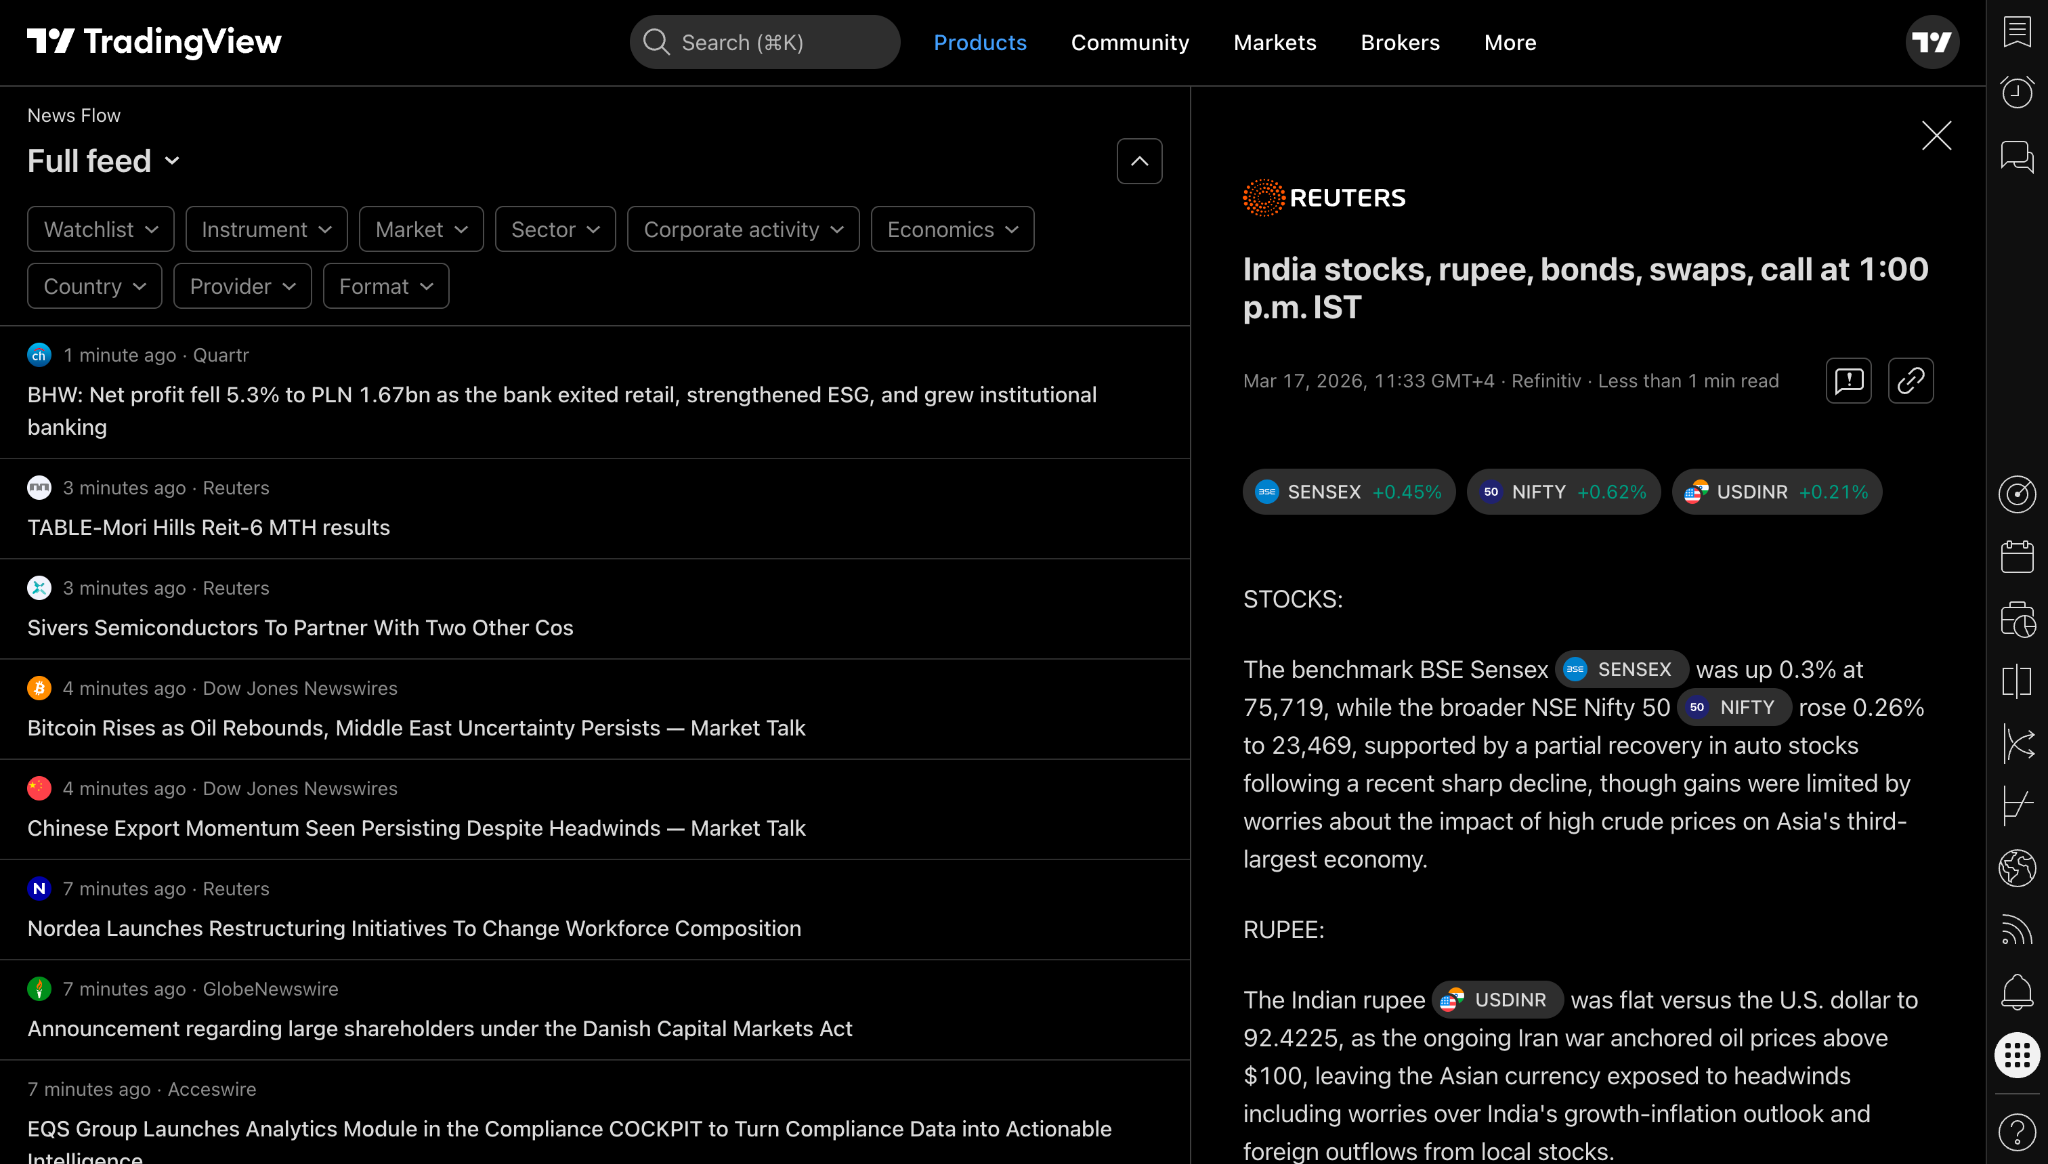
TradingView’s News Flow helps traders keep market headlines inside the same environment where they analyze charts.
That matters because jumping between too many tools can fragment your attention. One tab for charts, one tab for news, one tab for social media, one tab for economic data, and suddenly your trading session feels like piloting a spaceship made entirely of browser tabs.
A news tool helps centralize context.
News Flow can be useful for:
- Understanding why volatility increased
- Tracking market-moving headlines
- Watching sentiment changes
- Following macro developments
- Checking stock-specific news
- Adding context to technical setups
But there is a warning:
News can become addictive.
A trader can read every headline and still make poor decisions. More information does not automatically create better judgment. Sometimes it creates more noise.
Use news as context, not as a panic button.
A strong workflow is:
- Check major headlines before analysis.
- Do chart analysis separately.
- Use news to explain context, not force bias.
- Avoid emotional trades immediately after shocking headlines.
- Journal how news affected your decision-making.
The goal is not to react to everything.
The goal is to understand what matters.
TradingView Community Ideas: Learn Without Copying
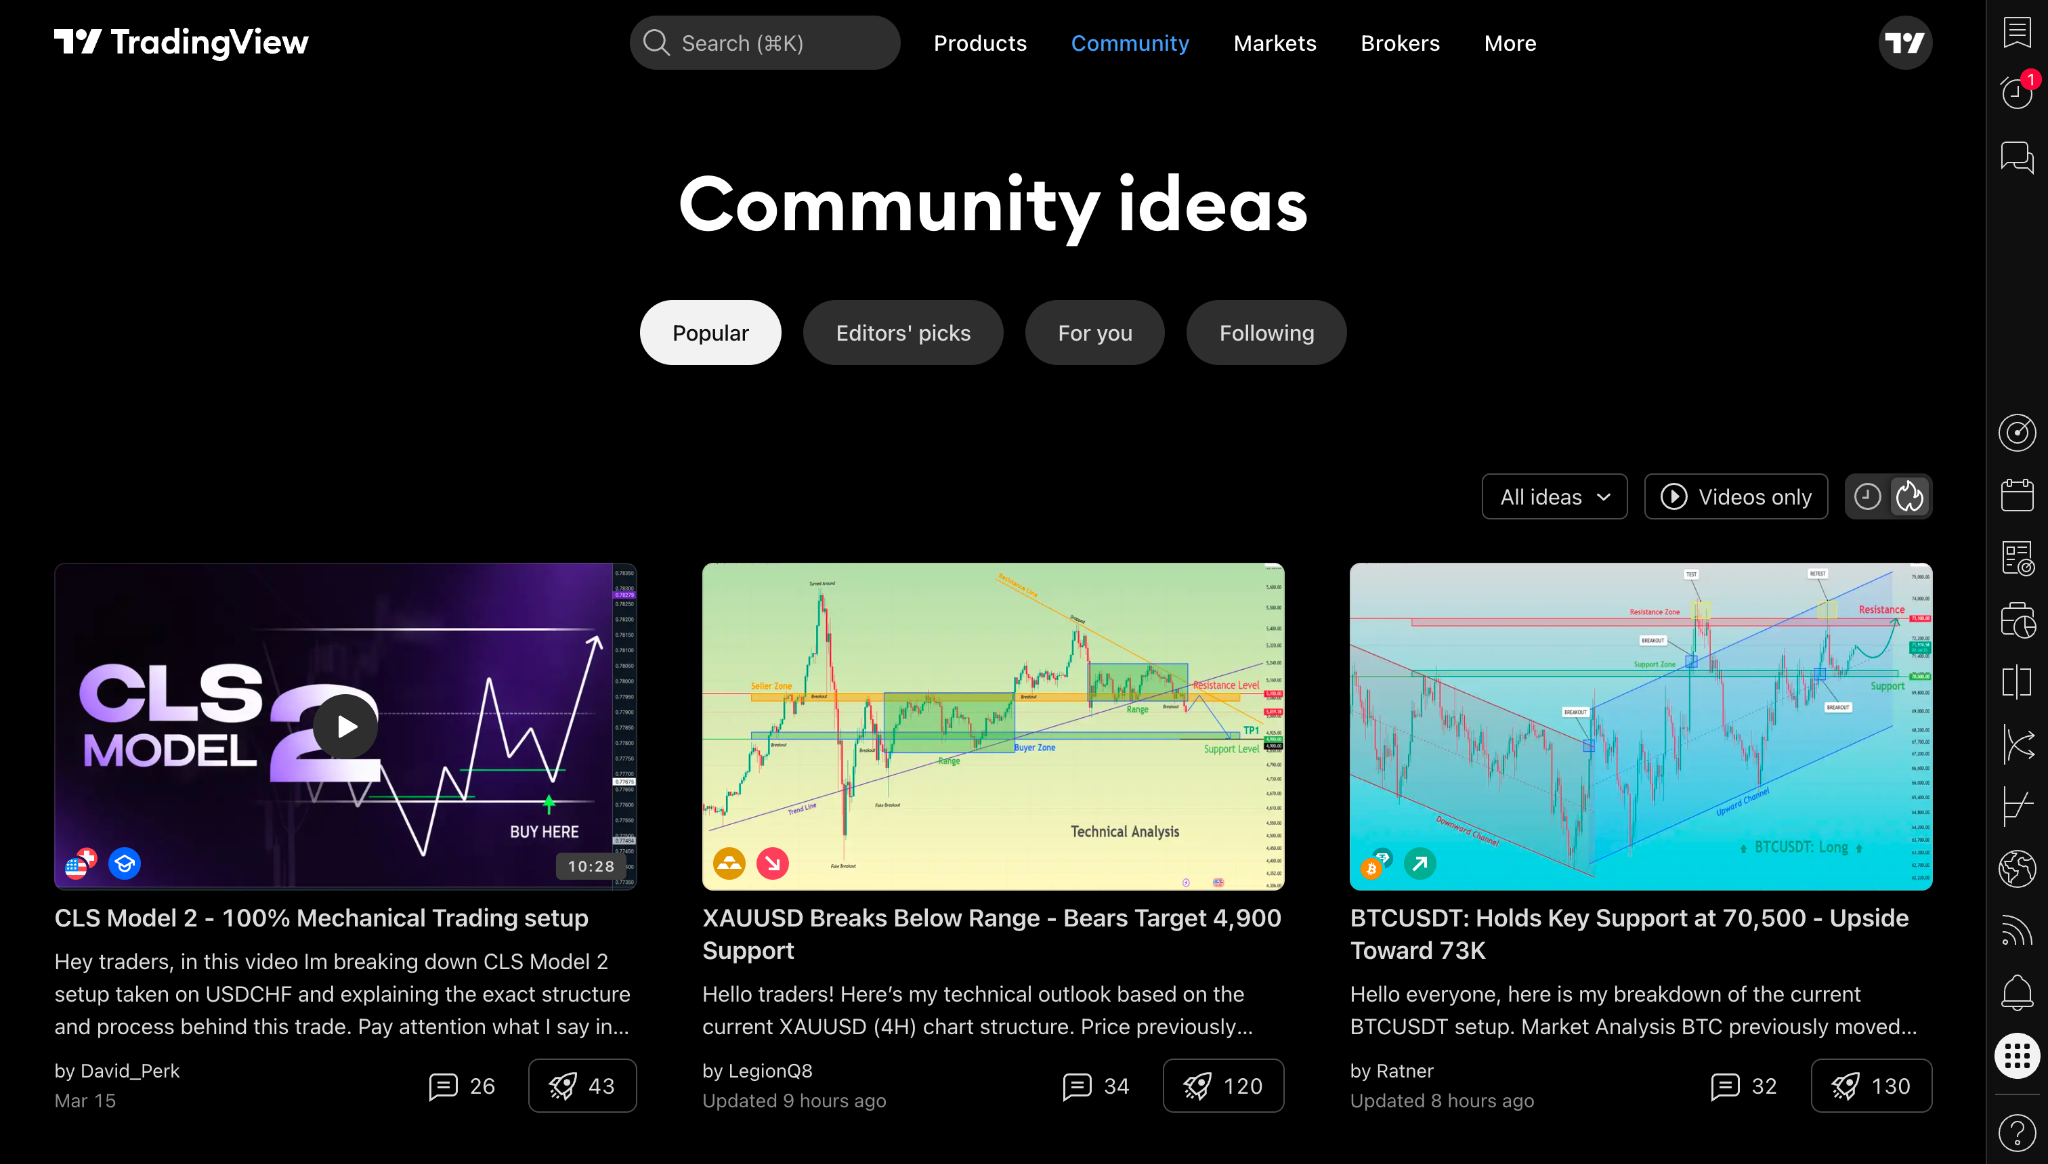
TradingView includes a public community where users share market ideas, technical analysis, educational posts, and scripts.
This is one of its most powerful features for learning, but also one of the easiest to misuse.
The wrong way to use TradingView ideas:
- Copy someone’s trade.
- Enter without your own plan.
- Ignore risk.
- Blame the author if it fails.
- Repeat the same mistake tomorrow.
The right way to use TradingView ideas:
- Study how other traders structure analysis.
- Compare their levels with yours.
- Notice what evidence they use.
- Learn different frameworks.
- Save useful educational examples.
- Build your own independent process.
The community can accelerate learning because it exposes you to many chart interpretations. You may see a Wyckoff range, an ICT liquidity sweep, a trend continuation setup, and a macro chart all on the same day.
But the responsibility remains yours.
A public chart idea is not a personalized trading plan.
It is a piece of analysis.
Treat it as education.
If your audience is learning ICT and Wyckoff, this section should internally link to:
- Wyckoff Events Explained — Springs, UTAD, SOW, SOS
- ICT Smart Money Concepts — Liquidity Pools and Smart Money
This keeps readers inside your content ecosystem after they understand TradingView’s community layer.
TradingView Paper Trading and Broker Connections
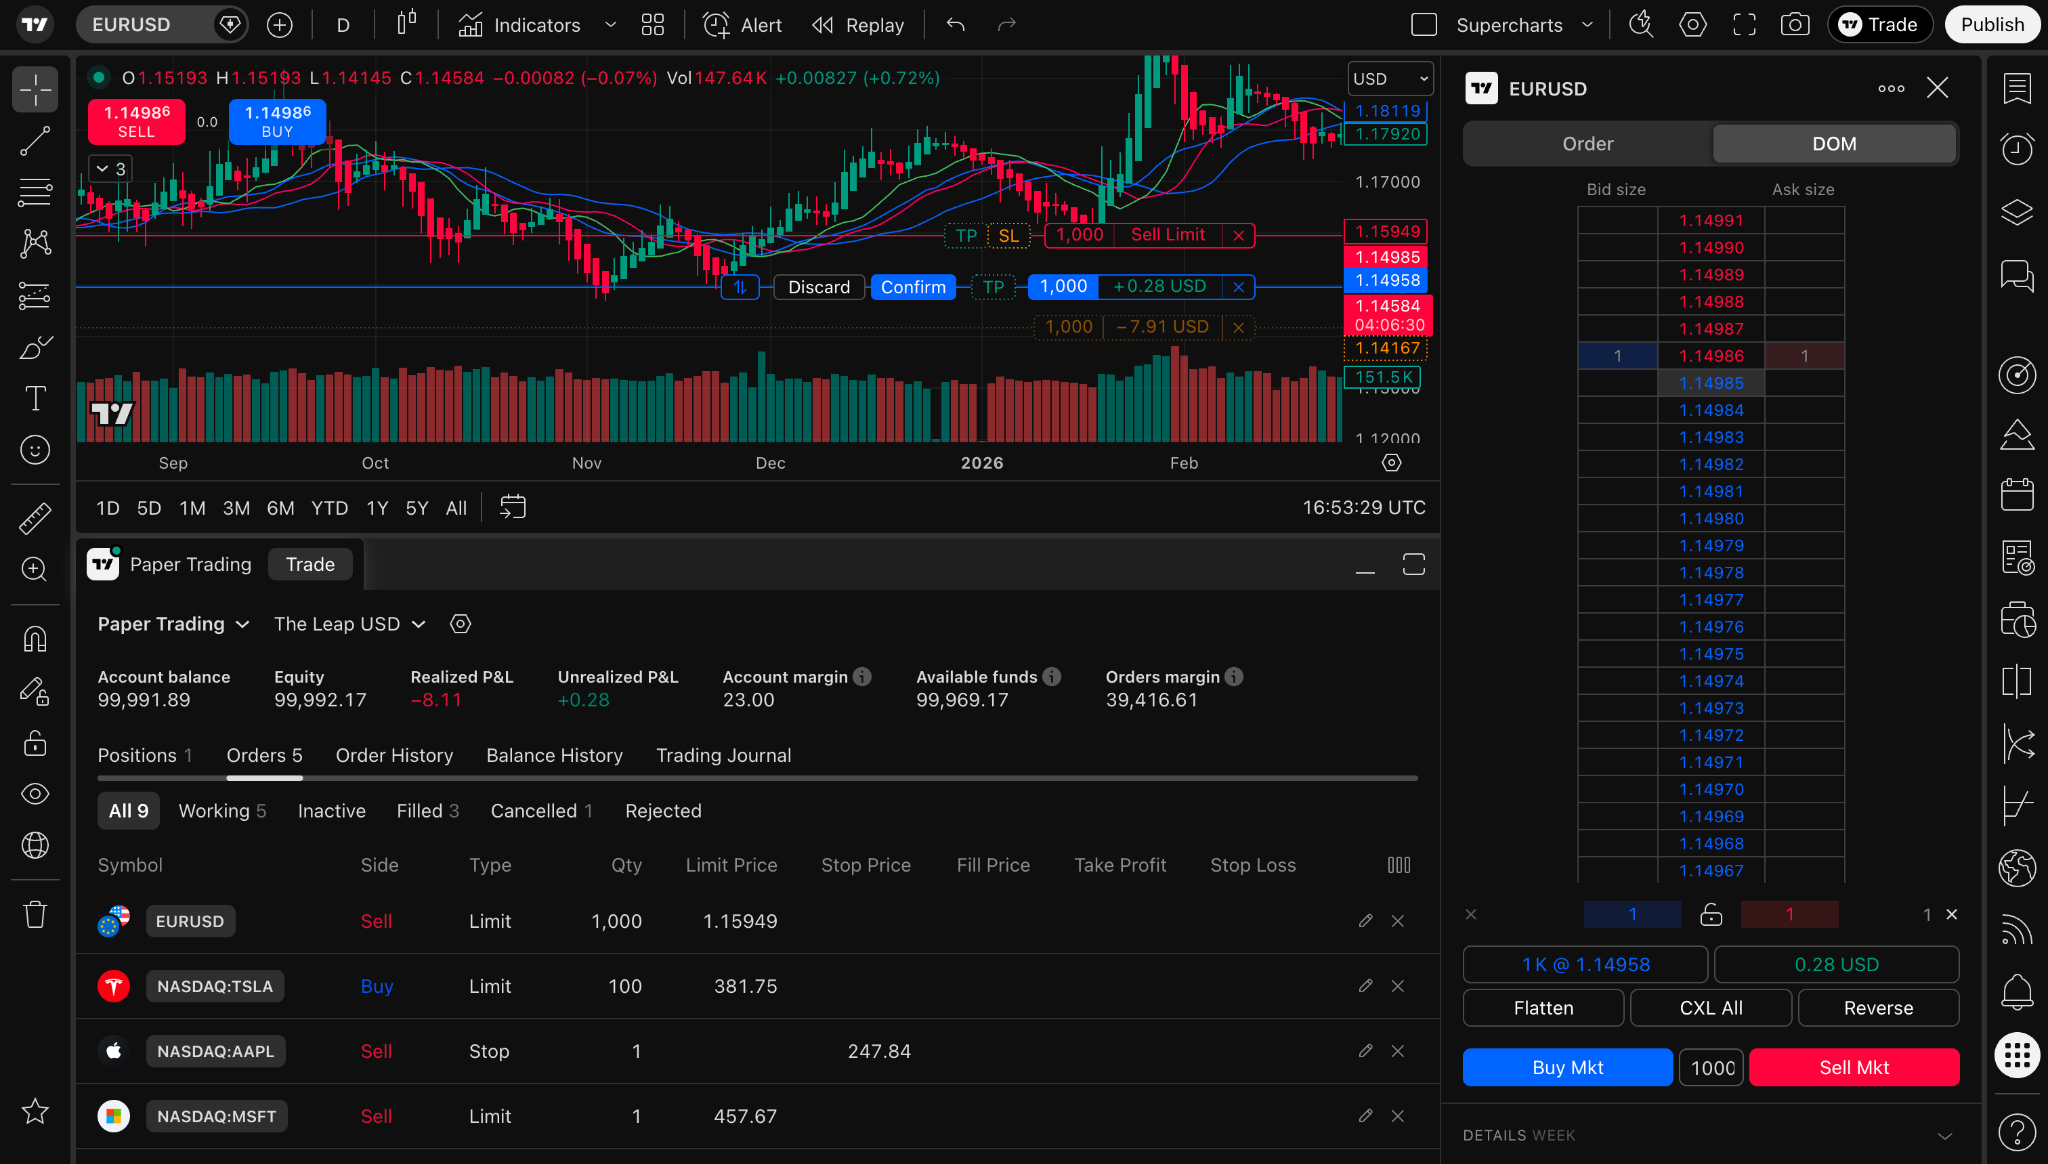
Analysis is only one part of trading.
Execution is another.
TradingView supports paper trading and broker connections, depending on the market and broker availability in your region.
Paper trading lets users practice without using real money. This is useful for beginners because it allows them to test routines, order entry, stop placement logic, and journaling habits without risking capital.
It is also useful for experienced traders testing a new strategy.
However, paper trading has limits. It does not fully recreate the emotions of live trading. A simulated loss does not feel the same as a real one. A simulated win does not trigger the same overconfidence.
Still, it is far better to discover basic process problems in simulation than with live capital.
A strong paper trading workflow:
- Define one setup.
- Define entry criteria.
- Define invalidation criteria.
- Define risk rules.
- Practice the setup in paper trading.
- Journal every trade.
- Review after a meaningful sample size.
- Adjust the process before going live.
This is where many traders fail.
They jump from watching videos directly into real risk. That is like reading one swimming article and sprinting into the ocean during a storm.
Practice matters.
Paper trading gives you a safer training ground.
For your site, this section is a natural internal link to:
Risk Management Guide — Protecting Your Capital
That link is important because paper trading should lead into risk education, not reckless confidence.
TradingView Portfolio Tracking: Measure What Matters
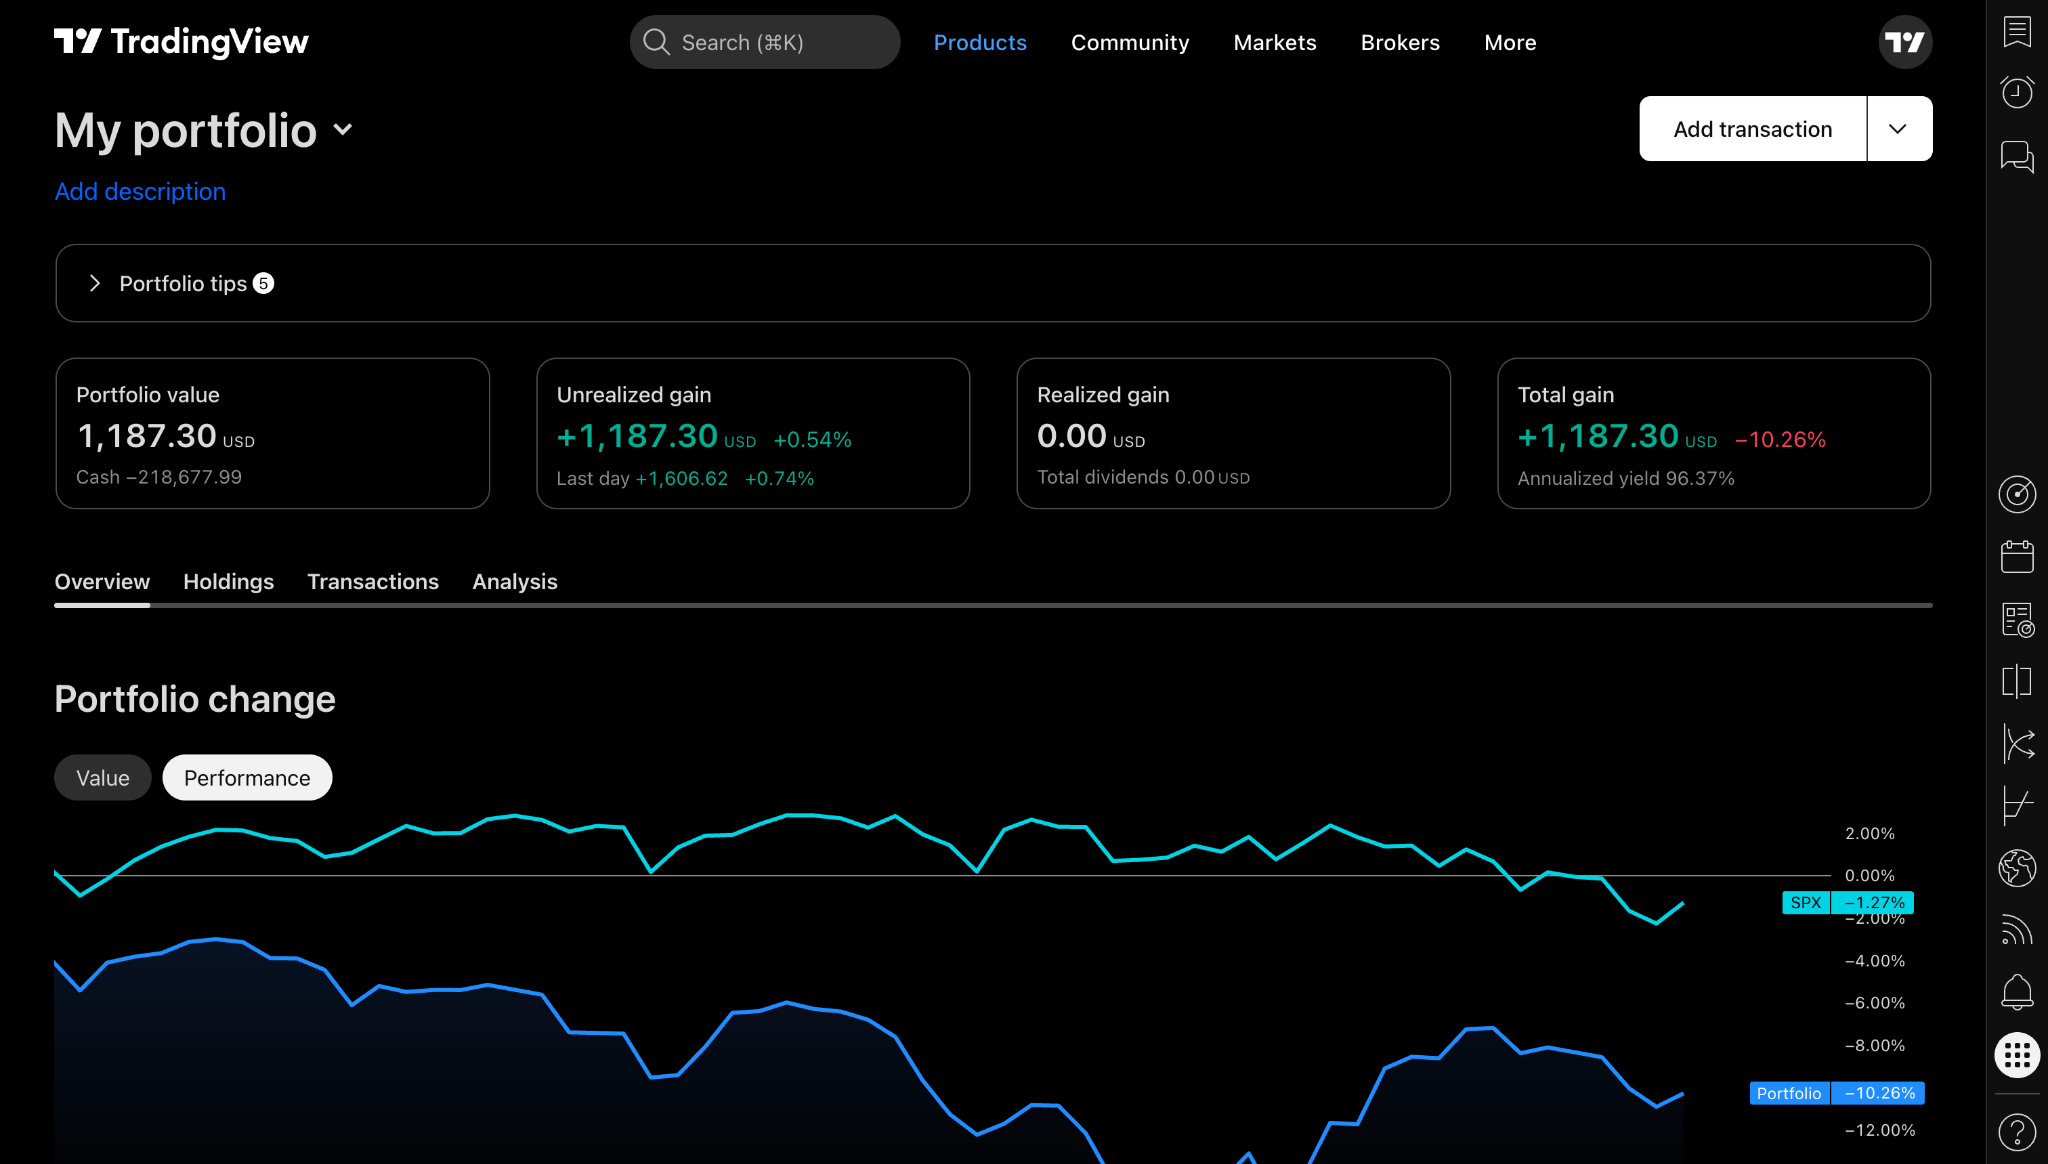
TradingView also offers portfolio-related tools that help users track assets and performance.
Performance tracking matters because traders are often terrible at judging themselves from memory. After three wins, they feel unstoppable. After two losses, they feel cursed by the moon. Neither feeling is data.
A portfolio or journal helps reveal reality.
Useful questions include:
- Are you actually improving?
- Which market do you trade best?
- Which session produces your worst decisions?
- Are your losses larger than planned?
- Are your wins consistent or random?
- Are you breaking rules after news events?
- Are you overtrading after a loss?
- Are you holding winners differently from losers?
TradingView can support market and portfolio visibility, but deeper process review usually requires a dedicated workflow.
That is where MyTradingApps.com comes in.
MyTradingApps is built around a connected trading workflow: structure, timing, journaling, discipline, and review. Instead of only looking at charts, traders can organize their analysis, review patterns, track routines, and build a more repeatable process.
TradingView helps you see the market.
MyTradingApps helps you review yourself.
That combination is where real improvement starts.
Pine Script: Custom Indicators and Advanced Workflows
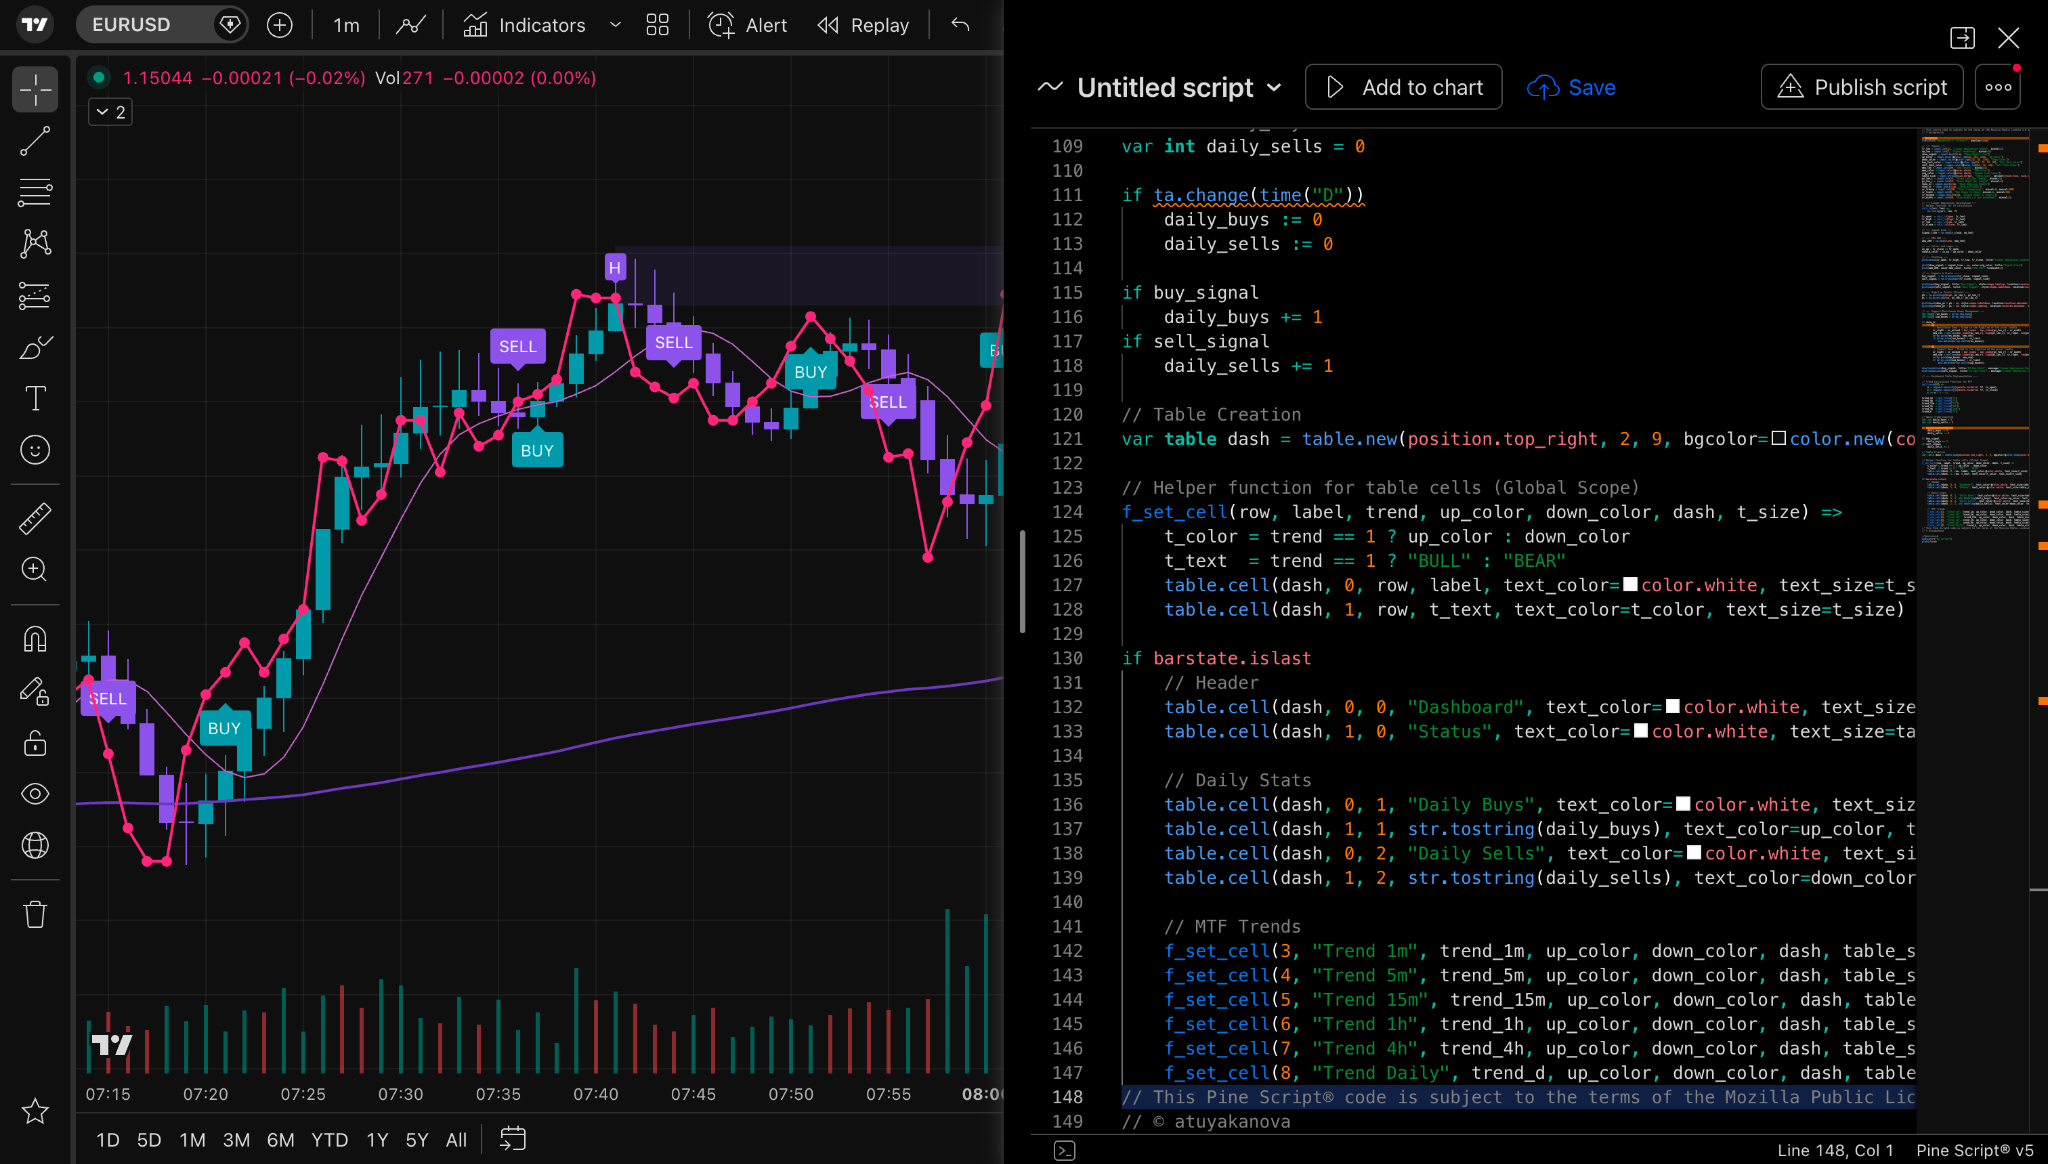
Pine Script is TradingView’s scripting language. It allows users to create custom indicators, strategies, alerts, and chart tools.
This is one of the features that makes TradingView attractive for advanced users.
With Pine Script, traders can:
- Create custom indicators
- Modify existing ideas
- Build alert conditions
- Backtest strategy logic
- Visualize unique market rules
- Share or publish scripts
You do not need Pine Script as a beginner. In fact, beginners should probably avoid rushing into custom scripts too early. Learn basic chart reading first. Understand price, trend, range, structure, volatility, and risk.
But once you know what you are trying to study, Pine Script can become powerful.
For example, a trader might use Pine Script to highlight session windows, mark certain volatility conditions, identify custom moving average behavior, or build reminders around a rules-based system.
The danger is the same as with indicators:
A custom script is not automatically an edge.
It is only useful if it supports a clear process.
If a script makes you more impulsive, it is not helping.
If it makes your rules easier to follow, it might be valuable.
TradingView Pricing: Free vs Paid Plans
TradingView has a free plan and several paid plan options. The exact plan names, prices, and limits can change, so always check the official TradingView pricing page before buying.
At the time of this package, TradingView’s official pricing page listed non-professional plans such as Essential, Plus, Premium, and higher-tier options, with differences in:
- Charts per tab
- Indicators per chart
- Historical bars
- Parallel chart connections
- Price alerts
- Technical alerts
- Watchlist alerts
- Advanced chart types
- Custom timeframes
- Bar Replay
- Data export
- Priority support
- Additional professional-level capabilities on higher plans
The practical breakdown is:
Free Plan
Best for:
- Beginners
- Learning the platform
- Basic charting
- Occasional analysis
Limitations may include:
- Ads
- Fewer alerts
- Fewer indicators
- Fewer layout options
- Less flexibility for active workflows
Essential Plan
Best for:
- Newer active traders
- Traders who want no ads
- Traders who need more indicators and alerts than free
This is often the first meaningful upgrade level for people who use charts consistently.
Plus Plan
Best for:
- More active traders
- Multi-chart users
- Traders who want more alerts and more chart flexibility
This can be useful if you monitor several markets or timeframes.
Premium Plan
Best for:
- Serious retail traders
- Heavy chart users
- Traders who rely on alerts, layouts, and deeper platform features
Premium is usually overkill for casual users but attractive for people who live inside charts daily.
Professional Plans
Best for:
- Professional users
- Higher-demand workflows
- Users who need more capacity and professional-grade access
Most retail beginners do not need these.
Important Pricing Note
Market data may have separate costs depending on the asset class, exchange, country, and user status. A TradingView subscription does not necessarily mean every exchange data feed is included in real time.
This is especially important for stock, futures, and professional data users.
Always verify current plan details and data costs directly on TradingView before purchasing.
Want to compare current plans now?
👉 See TradingView pricing here
Is TradingView Good for Beginners?
Yes, TradingView is one of the best charting platforms for beginners because the interface is clean, visual, and easier to learn than many older trading platforms.
But beginners should use it carefully.
The best beginner workflow is not:
- Add every indicator.
- Follow random community ideas.
- Chase volatile assets.
- Upgrade too fast.
- Trade live before understanding risk.
The better beginner workflow is:
- Open a free TradingView account.
- Learn candlesticks and timeframes.
- Build a small watchlist.
- Practice marking support and resistance.
- Learn one or two indicators max.
- Study economic calendar events.
- Use paper trading before risking real money.
- Journal every trade idea.
- Review mistakes weekly.
- Only upgrade when platform limits actually slow your process.
Beginners should focus on learning how markets move, not trying to look advanced.
A clean chart, a simple routine, and consistent review will beat a messy chart with 12 indicators and no rules.
This is exactly why MyTradingApps is positioned as a system layer. The goal is not to replace TradingView. The goal is to help traders turn chart analysis into a structured learning and review process.
Explore the workflow here:
TradingView for Forex Traders
TradingView is especially useful for forex traders because it supports multi-timeframe charting, currency pairs, session analysis, economic calendar awareness, and clean technical drawing tools.
Forex traders often need to understand:
- London session behavior
- New York session behavior
- Asian session ranges
- News volatility
- Liquidity above and below ranges
- Round numbers
- Higher-timeframe context
- Intraday execution windows
TradingView gives the charting environment for this. MyTradingApps can support the educational workflow around timing, structure, review, and discipline.
For forex-focused internal linking, use:
This keeps forex readers moving into your strongest topical cluster.
TradingView for Crypto Traders
Crypto traders benefit from TradingView because crypto markets move 24/7 and TradingView supports a wide range of crypto symbols, exchanges, charts, indicators, and community ideas.
Crypto traders often use TradingView for:
- Bitcoin and Ethereum analysis
- Altcoin watchlists
- Crypto screeners
- Volume analysis
- Market structure
- Breakout setups
- Long-term trend monitoring
- Community idea research
Because crypto moves continuously, alerts become especially valuable. Without alerts, traders may feel pressured to watch charts constantly. That is a recipe for burnout.
TradingView alerts can help crypto traders define levels and step away.
But crypto also brings high volatility. That makes risk management and journaling even more important.
A chart tells you what happened.
Your review process tells you whether your decisions are improving.
TradingView for Stock Traders
Stock traders can use TradingView for chart analysis, watchlists, screeners, earnings awareness, news, sector tracking, and long-term portfolio review.
The stock screener is particularly useful because the stock market includes thousands of symbols. Without filters, opportunity discovery becomes chaos.
TradingView can help stock traders filter by:
- Market cap
- Volume
- Price change
- Technical conditions
- Sector
- Exchange
- Performance metrics
- Earnings-related context
Stock traders should also pay attention to data feed requirements. Depending on your location, exchange, and needs, real-time market data may require separate payment. Long-term investors may be fine with delayed data. Day traders usually need real-time data.
Again, verify directly on TradingView before buying.
TradingView vs MetaTrader
MetaTrader, especially MT4 and MT5, is widely used in forex and CFD trading. It has a long history, broker integrations, expert advisors, and a strong automated trading ecosystem.
But compared with TradingView, MetaTrader often feels less modern.
TradingView advantages
- Cleaner interface
- Easier browser access
- Better visual charting experience
- Stronger community idea layer
- Easier chart sharing
- Better for educational chart annotations
- Cloud-based layout syncing
MetaTrader advantages
- Popular with many forex brokers
- Strong automated trading ecosystem
- Expert Advisors
- Familiar to long-time forex traders
- Direct broker execution in many environments
Which is better?
For visual analysis and modern charting, TradingView is usually better.
For broker-specific execution and automated Expert Advisor workflows, MetaTrader may still matter.
Many traders use both: TradingView for analysis, MetaTrader or broker platforms for execution.
TradingView vs Thinkorswim
Thinkorswim is a powerful platform, especially for U.S. stock and options traders. It includes advanced tools, scanning, options analytics, and deep market functionality.
TradingView is generally easier to use and more accessible across devices, while Thinkorswim may offer deeper broker-specific tools for certain markets.
TradingView advantages
- More beginner-friendly interface
- Better social and idea-sharing features
- Cleaner chart sharing
- Easier web access
- Strong multi-asset charting experience
Thinkorswim advantages
- Strong brokerage integration
- Advanced options tools
- Deep U.S. market functionality
- Powerful for experienced stock/options traders
Which is better?
If you want clean charts, multi-asset analysis, and an easier learning curve, TradingView is likely the better starting point.
If you are focused heavily on U.S. options and need broker-specific tools, Thinkorswim may be worth comparing.
TradingView vs TrendSpider
TrendSpider is another technical analysis platform known for automation, scanners, and automated charting features.
TradingView’s advantage is its massive ecosystem, community, charting experience, and broad market coverage. TrendSpider may appeal to traders who want automated technical analysis and scanning tools.
TradingView advantages
- Larger community
- More recognizable charting ecosystem
- Pine Script flexibility
- Stronger social layer
- Broad usability across markets
TrendSpider advantages
- Automated technical analysis features
- Scanning and automation focus
- Useful for certain systematic workflows
Which is better?
TradingView is the better all-around charting platform for most traders.
TrendSpider may be useful for traders who specifically want automated pattern detection and scanner-heavy workflows.
TradingView Pros and Cons
TradingView Pros
1. Excellent charting experience
The charts are smooth, flexible, and easy to use.
2. Works across devices
Browser, desktop, and mobile access make it convenient.
3. Strong alert system
Alerts help traders wait for levels instead of staring at charts.
4. Huge indicator library
Built-in and community-created indicators create massive flexibility.
5. Pine Script
Advanced users can build custom indicators and strategies.
6. Screeners
Stock, crypto, ETF, and other screeners help identify opportunities faster.
7. Economic calendar and news
Context tools reduce the need to jump between platforms.
8. Community ideas
The social layer helps traders learn from other chart interpretations.
9. Paper trading
Useful for practice before live risk.
10. Strong for education
Charts are easy to annotate, share, and use in learning workflows.
TradingView Cons
1. Free plan is limited
Useful for learning, but active traders may hit limits quickly.
2. Data may cost extra
Some real-time data feeds can require additional payments.
3. Too many features can overwhelm beginners
The platform is simple to start, but deep enough to distract.
4. Community ideas can encourage copying
Beginners must avoid blindly following public posts.
5. A platform is not a process
TradingView gives tools, but traders still need discipline, journaling, risk rules, and review.
The Biggest Mistake Traders Make With TradingView
The biggest mistake is thinking TradingView will make them better automatically.
It will not.
TradingView can show you better charts, faster alerts, cleaner watchlists, and more analysis tools. But it will not force you to follow your rules. It will not stop revenge trading. It will not tell you that you are repeating the same emotional mistake every Friday afternoon.
That is why the platform should sit inside a bigger workflow.
Here is a better model:
Step 1: Use TradingView for market visibility
Open charts, study structure, check news, mark levels, set alerts, and monitor key events.
Step 2: Use MyTradingApps for process structure
Use MyTradingApps.com to connect analysis, journaling, discipline, timing, and review into a repeatable workflow.
Step 3: Review your behavior
Look for patterns in your decisions, not only the market.
Step 4: Improve the process
Refine what you do before, during, and after trades.
The trader who reviews process will usually grow faster than the trader who only searches for the next indicator.
How to Use TradingView the Right Way
Here is a practical TradingView workflow that fits most traders.
1. Build a focused watchlist
Do not track everything. Start with a small list of markets you actually understand.
2. Check the economic calendar
Know when major events may affect volatility.
3. Start with higher timeframes
Understand the broader market context before zooming into smaller charts.
4. Mark only important levels
Avoid turning the chart into a spiderweb.
5. Set alerts
Let price come to your areas instead of chasing candles.
6. Use indicators sparingly
Every indicator should have a job.
7. Study community ideas for education
Do not copy. Learn.
8. Practice with paper trading
Test your rules before live risk.
9. Journal your decisions
Record the reason for every trade idea, not just the result.
10. Review weekly
Find repeated mistakes and repeated strengths.
This workflow turns TradingView from a charting app into part of a trading operating system.
Where MyTradingApps.com Fits In
TradingView is excellent for charting and market visibility.
But the trader still needs a process.
MyTradingApps.com is built as a private trading workspace around structure, review, routine, and timing. Instead of separating chart analysis, journaling, discipline, and session awareness into disconnected tools, MyTradingApps brings the workflow into one hub.
The goal is not to replace TradingView.
The goal is to complete the workflow around it.
Use TradingView when you need to see the market.
Use MyTradingApps when you need to understand and improve your process.
That combination creates a stronger loop:
- **Chart** the market in TradingView.
- **Prepare** your plan and timing context.
- **Set alerts** so you are not glued to the screen.
- **Practice** execution with paper trading if needed.
- **Journal** your decisions and outcomes.
- **Review** patterns in your performance.
- **Refine** your process.
That is how traders move away from random behavior and toward repeatable improvement.
Explore the full workflow here:
Or compare the workspace plans here:
Best TradingView Plan for Beginners
The best TradingView plan for beginners is usually the free plan at first.
Why?
Because beginners do not need more tools yet. They need more clarity.
Start free and learn:
- How charts work
- How timeframes work
- How alerts work
- How watchlists work
- How indicators work
- How economic events affect price
- How paper trading feels
- How to review your own decisions
Upgrade only when you know exactly what limitation is slowing you down.
For example, upgrade when:
- You need more alerts.
- You need more indicators per chart.
- You want multiple charts in one layout.
- You want an ad-free workspace.
- You need deeper historical data.
- You trade actively enough that friction costs you focus.
Do not upgrade because you think paying makes you professional.
Upgrade when the tool improves your process.
That is the cleanest rule.
Best TradingView Plan for Active Traders
Active traders usually benefit from paid plans because alerts, multi-chart layouts, and extra indicators can make daily workflow smoother.
If you regularly monitor multiple symbols or timeframes, the free plan may feel restrictive.
Paid plans are worth considering when your workflow includes:
- Multiple markets
- Multiple timeframes
- Several alerts
- Indicator combinations
- Saved chart layouts
- Daily review
- More serious routine
The key word is workflow.
If you do not have a workflow, upgrading will only give you a bigger playground for the same bad habits.
Before upgrading, ask:
- Do I know what setups I trade?
- Do I use alerts properly?
- Do I review my trades?
- Do I understand my risk?
- Do I have a weekly process?
- Do I know why I need this plan?
If yes, a paid TradingView plan can be a strong investment in your trading infrastructure.
If not, fix the process first.
Who Should Use TradingView?
TradingView is a good fit for:
- Beginner traders learning chart analysis
- Forex traders studying sessions and structure
- Crypto traders watching 24/7 markets
- Stock traders building watchlists
- Swing traders reviewing higher timeframes
- Day traders setting alerts and monitoring volatility
- Technical analysts creating chart ideas
- Educators explaining market behavior
- Traders who want clean charts across devices
- Traders who want paper trading practice
TradingView may not be the best fit if:
- You only want broker-specific order execution
- You need highly specialized institutional tools
- You do not use chart analysis
- You want the platform to make decisions for you
- You are looking for guaranteed trading signals
No platform should be treated as a shortcut to guaranteed results.
Trading does not work like that.
TradingView SEO FAQ
Is TradingView free?
Yes. TradingView offers a free plan with basic charting access. The free plan is useful for beginners, but it has limitations compared with paid plans, including fewer alerts, fewer indicators, and less workspace flexibility.
Is TradingView worth it?
TradingView is worth it for many traders because it combines charts, indicators, alerts, screeners, news, calendar tools, community ideas, paper trading, and Pine Script in one platform. The paid plans are most useful for active traders who need more alerts, chart layouts, and advanced features.
Is TradingView good for beginners?
Yes. TradingView is beginner-friendly because the interface is clean and visual. Beginners should start simple, avoid too many indicators, use paper trading, and focus on learning price behavior before upgrading.
Can you trade directly from TradingView?
TradingView supports broker connections and paper trading. Available brokers and live trading functionality depend on your region, market, and supported broker list. Always check TradingView and your broker directly.
Does TradingView have paper trading?
Yes. TradingView includes paper trading functionality that allows users to practice trade execution without risking real money. Paper trading is useful for learning, testing rules, and building confidence, but it does not fully replicate the emotions of live trading.
What is TradingView Pine Script?
Pine Script is TradingView’s scripting language for creating custom indicators, strategies, and alerts. It is useful for advanced users who want to build custom tools or test structured ideas.
Is TradingView better than MetaTrader?
TradingView is usually better for clean charting, visual analysis, social ideas, and browser-based access. MetaTrader may still be useful for broker-specific forex execution and automated Expert Advisor workflows. Many traders use both.
Does TradingView include real-time data?
TradingView provides access to many markets, but some exchange data may be delayed or require separate payment. Always check the current TradingView pricing and market data pages for your region and asset class.
What is the best TradingView plan?
The best plan depends on your workflow. Beginners can usually start free. Active traders may prefer paid plans for more alerts, more indicators, multiple charts, and a cleaner workspace. Check current plan details before buying.
How does MyTradingApps work with TradingView?
TradingView can be used for charting and market analysis. MyTradingApps.com can support the wider trading workflow around structure, journaling, discipline, timing, and educational review. TradingView helps you see the market; MyTradingApps helps you build a repeatable process.
Final Verdict: Should You Use TradingView in 2026?
Yes, TradingView is one of the best charting platforms for traders in 2026.
It is powerful, flexible, clean, and packed with useful tools. It works well for forex, crypto, stocks, indices, commodities, and multi-asset analysis. It gives traders charts, alerts, screeners, calendar tools, news, community ideas, paper trading, and Pine Script.
But the final truth is this:
TradingView gives you visibility. Your process creates improvement.
If you only open charts and react emotionally, even the best platform will not save you.
If you use TradingView with a structured workflow, it becomes much more valuable.
Use it to:
- Analyze markets
- Mark structure
- Set alerts
- Track events
- Study ideas
- Practice execution
- Build awareness
Then connect that with review, journaling, discipline, and timing through MyTradingApps.com.
That is how a charting platform becomes part of a full trading system.
Start TradingView Today
If you want to use TradingView for charting, alerts, screeners, paper trading, and market analysis, start here:
Build the charting workspace first.
Then build the process around it.
Next Step: Build Your Trading Workflow
Charts are only the beginning.
If you want to connect market analysis with review, journaling, discipline, and timing, explore MyTradingApps:
Compare plans here:
Read more educational guides here:
👉 Browse MyTradingApps articles
Educational use only. Not financial advice. Trading involves risk.